TL;DR
Unlike FID, which only measured the delay of the first interaction, INP tracks the time from user interaction to visual feedback throughout a session—better reflecting real-world user experience. To improve INP, focus on minimizing JavaScript execution, reducing DOM size, lazy loading HTML, and eliminating unused CSS. Tools like Chrome DevTools and Web Vitals extensions help identify problem areas, and solutions like NitroPack can automate key optimizations.
When it comes to Core Web Vitals’ development, one thing has been made clear since their introduction:
The user experience metrics will undergo changes.
Almost immediately after it was released, Google announced that it was working on a better responsiveness metric.
Fast-forward to 2023. After months of testing, fine-tuning, and gathering feedback from webmasters, Interaction to Next Paint (INP) was introduced as the official successor of First Input Delay (FID).
Which made website owners and developers ask the same question:
How am I going to deal with the new Core Web Vital?
And who better to answer it than Google themselves?
On August 16th, we launched the four-part “Core Web Vitals For Your Business” webinar series.

The replay of the second episode, “Introducing Interaction to Next Paint (INP)”, is now available for everyone on YouTube.
In the 60-minute long session, Google’s very own Barry Pollard and Adam Silverstein, along with NitroPack’s co-founder and CTO Ivailo Hristov, discussed:
- Interaction to Next Paint (INP) and its better way of measuring responsiveness
- The importance of providing users with good responsiveness
- Optimization strategies for passing INP
Read on for the webinar highlights and golden nuggets on future-proofing your site’s responsiveness.
Why INP: The Problem with First Input Delay (FID)
According to the HTTP archive, all websites have a good FID score on desktop and nearly all (93.8%) on mobile:
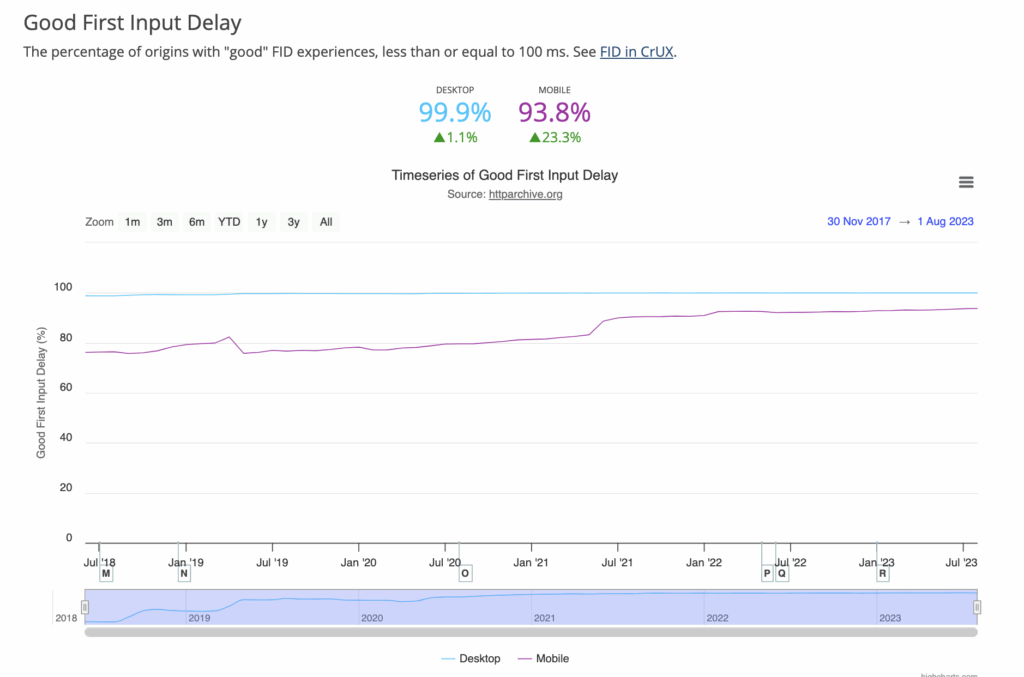
Immediately, we can conclude that experiencing a laggy website happens once in a blue moon.
Unfortunately, the reality is that the web often does have a responsiveness problem. And FID is no longer accurately measuring it.
When Core Web Vitals were first introduced, measuring the delay until the code can start to process an interaction was seen as a key blocker.
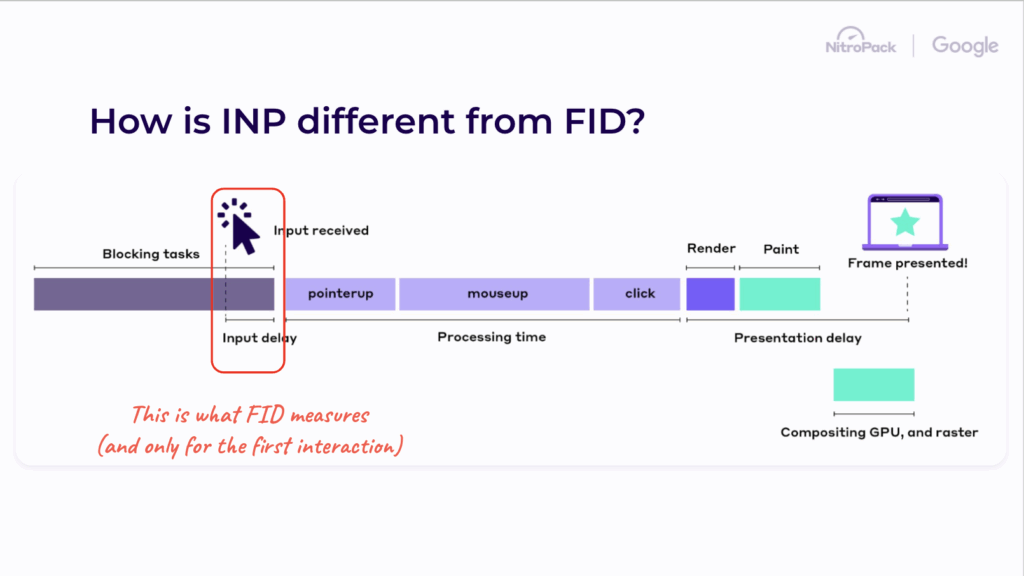
However, with the development of the Core Web Vitals, the Chrome team decided that the FID score isn’t a good representation of how real-world users experience page responsiveness.
Mainly because:
FID only measures the first interaction’s input delay, ignoring the processing time, presentation delay, and any successive interactions.
And user’s experience doesn’t stop after the first click.
Enter Interaction to Next Paint.
Interaction to Next Paint (INP): Explained
The technical definition of INP sounds like this:
“INP is a metric that assesses a page’s overall responsiveness to user interactions by observing the latency of all click, tap, and keyboard interactions that occur throughout the lifespan of a user’s visit to a page. The final INP value is the longest interaction observed, ignoring outliers.”
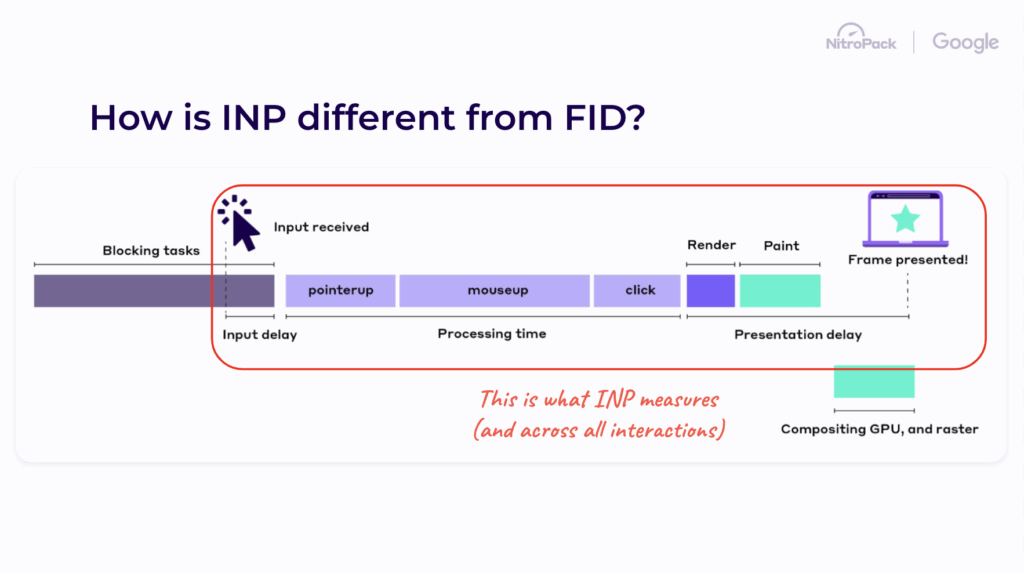
But if we dissect the name of this metric, the explanation is much simpler:
INP measures the time from the interaction (for example, a mouse click) until the browser is able to update (or paint) the screen.
And as Barry Pollard elaborated:
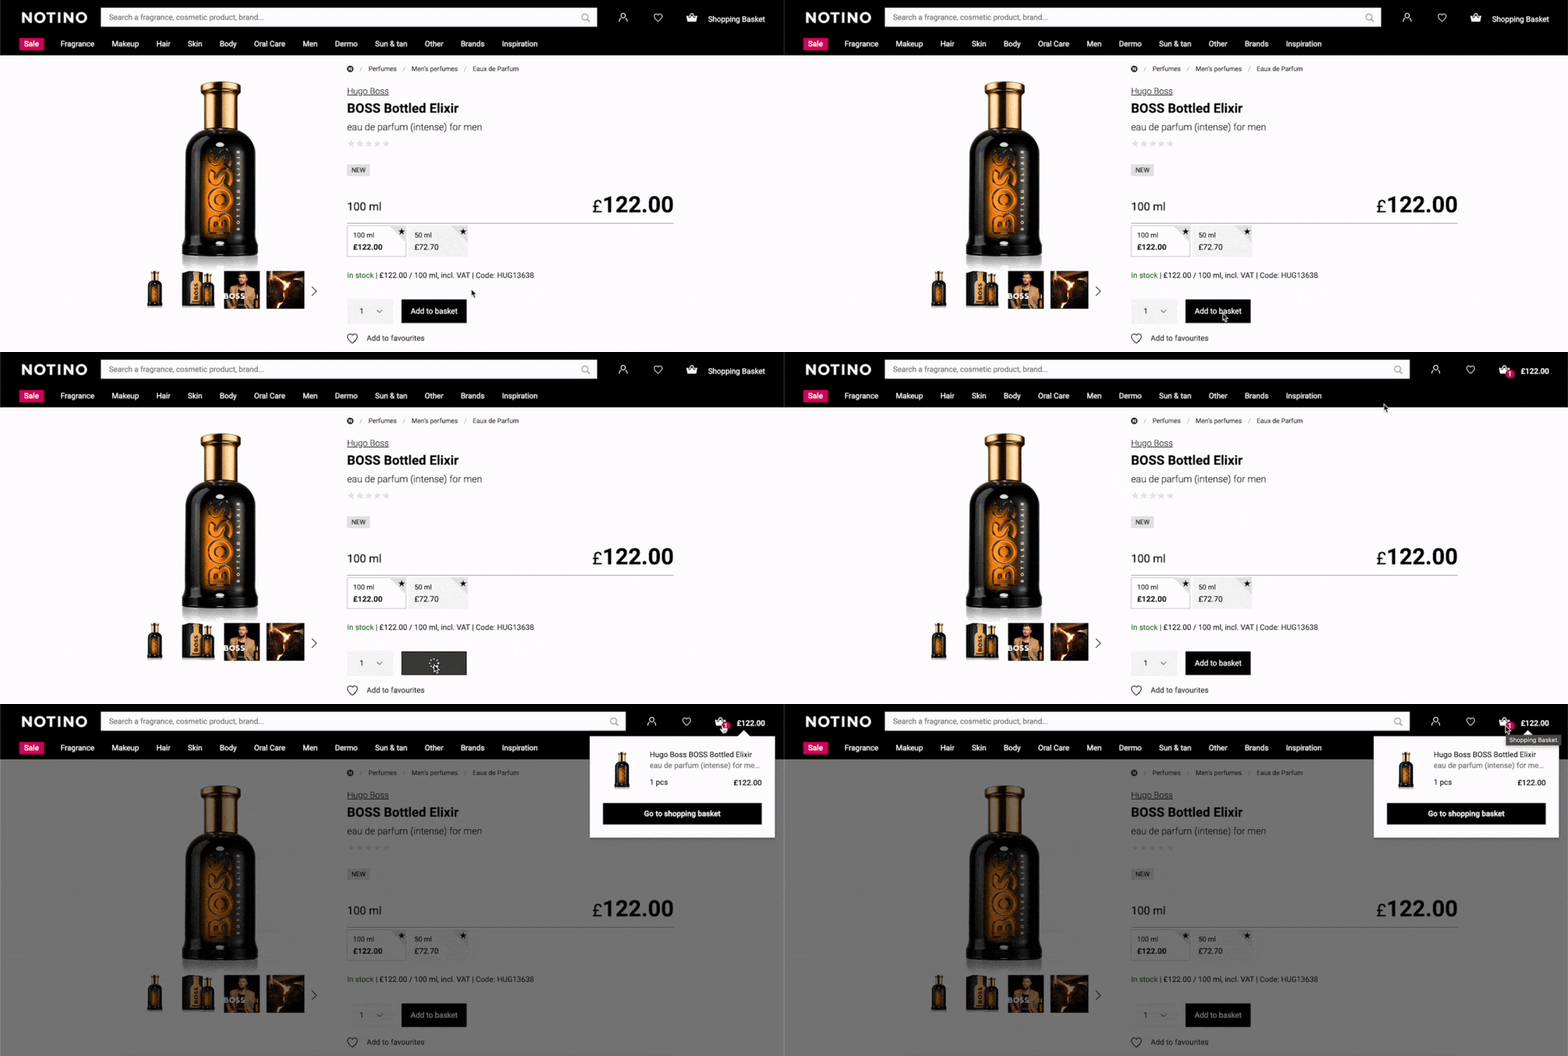
“Display some feedback (for example, “processing” or “adding to cart”) even if you cannot complete the full processing is a good thing. Blocking the next paint to complete all the interaction steps is bad for the user experience.”
If you think about it, every time we start rage-clicking, it is because there is no feedback that our action has been processed. For instance, how frustrating it is when you click “Add to cart” and there’s no visual change on the Cart icon that the item has been added.
That’s what INP measures.
And speaking of measuring…
How to measure INP the right way
Your Core Web Vitals assessment is based on how real users experience your websites. In other words – field data.
While lab-based tools can be used to test the metrics under certain, pre-defined conditions, when it comes to measuring responsiveness, it is crucial to measure in the field.
As Barry Pollard pointed out:
“Only in the field can we see all the interactions users do on our websites. And only with field data, can we see how those interactions are actually handled by our sites.”
There are a number of tools that can help you measure INP:
- PageSpeed Insights – shows the field INP from the Chrome User Experience Report
- Google Search Console – informs you about your site’s INP data grouped into page types
- The CrUX Dashboard – gathers your Core Web Vitals metrics over the last 12 months
- The Web Vitals JavaScript library – allows for more in-depth analysis of your Core Web Vitals field data
- The Web Vitals extension – provides CrUX Core Web Vitals field data and a real-time update of CWV as you interact with the page.
And although it might seem like INP requires a lot of work, trust us when we say – it’s worth it.
Here’s why:
Good Page Responsiveness: The Best Way to Impact Your Business Metrics
Oftentimes, when web performance is the point of discussion, people tend to focus solely on how fast a page loads. While still important, you don’t have to forget that:
90% of the user’s time on a page is spent after loading.
Hence, the importance of providing a seamless user experience.
And as Adam Silverstein opened his talk:
“Responsiveness is a critical part of how users experience your web page, and poor responsiveness leads to rage clicks, cart abandonment and generally less happy users who are less likely to stick around or come back.”
Two examples of businesses that take the “snappier site, happier customers” approach to heart are The Economic Times and RedBus.
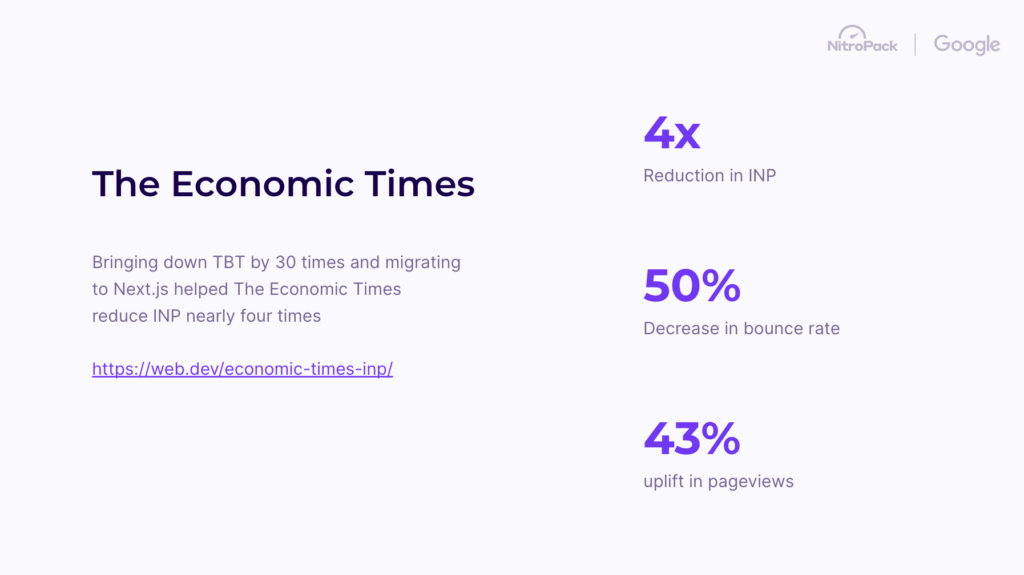
The former optimized their website’s responsiveness by focusing on Interaction to Next Paint.
Initially grappling with a high INP of 1,000 milliseconds and a Total Blocking Time of 3 seconds, they focused on several areas to improve:
- streamlined main thread tasks
- reducing script evaluations
- decreasing the DOM size.
They were able to cut their Total Blocking Time to 120 milliseconds and INP to 257 milliseconds. Applying these changes, they measured a 50% reduction in bounce rate and a 43% increase in page views, underscoring INP’s significance in enhancing user experience and driving business growth.
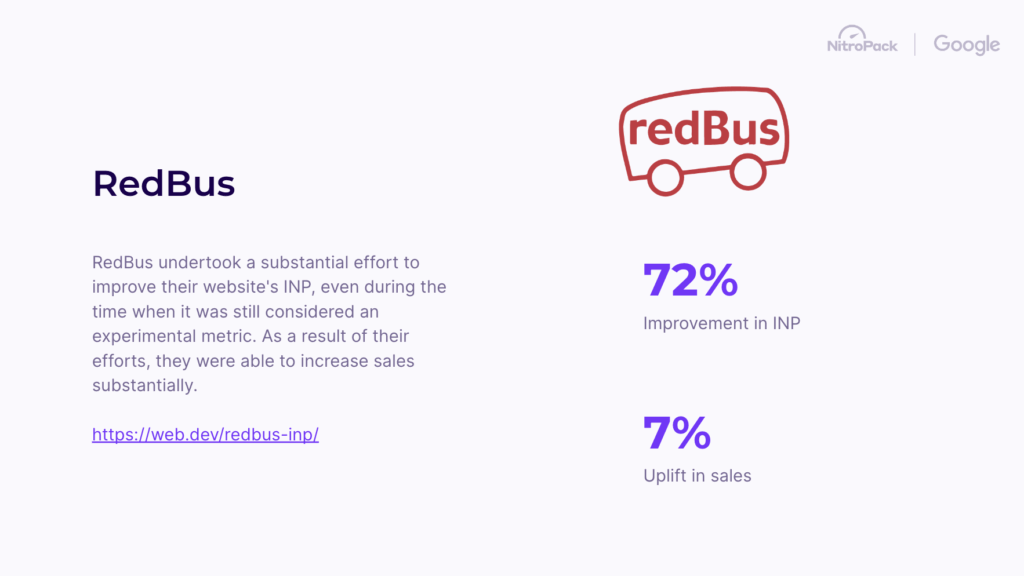
RedBus, on the other hand, optimized their website’s INP score by addressing latency issues from excessive JavaScript and API calls.
Initially, their lab testing showed satisfactory INP results. But as we already mentioned – the magic happens in the field. In other words, they identified the responsiveness culprits after switching to real user monitoring data.
They focused on these problematic interactions to ensure the main thread wasn’t blocked, prioritizing rendering and using smaller result batches and lazy loading. As a result, they saw:
- 72% improvement in INP
- 7% boost in sales
Not a bad result, right?
Let’s see how you can achieve it as well.
How to Fix Interaction to Next Paint
NitroPack’s CTO, Ivailo Hristov, demonstrated his favorite techniques to improve Interaction to Next Paint.
Test NitroPack yourself
By submitting, you agree to our Privacy Policy.
1. Identify what causes poor INP
Reviewing your field data and having a poor INP score is the biggest indicator you need to investigate further.

A great way to identify what is causing your INP issues is to use a combination of the following tools:
- The Web Vitals extension
- The Console in Chrome DevTools
- The Performance Profiler in Chrome DevTools
Step 1: Install the Web Vitals extension
First, install the Web Vitals extension. Open the settings panel, select “Console logging”, and save your settings.

This will allow you to see your page’s INP score in real-time with the second tool – Chrome DevTools.
Step 2: Identify the culprit in Chrome DevTools
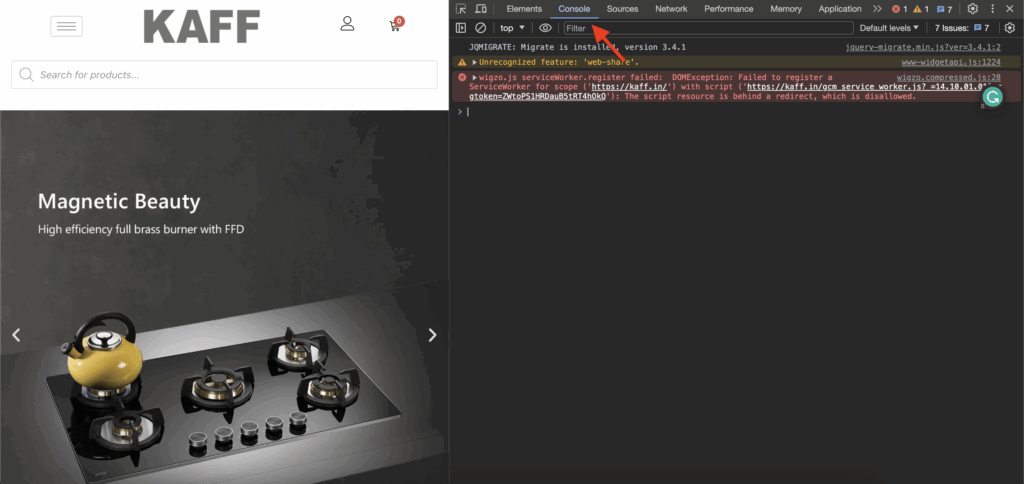
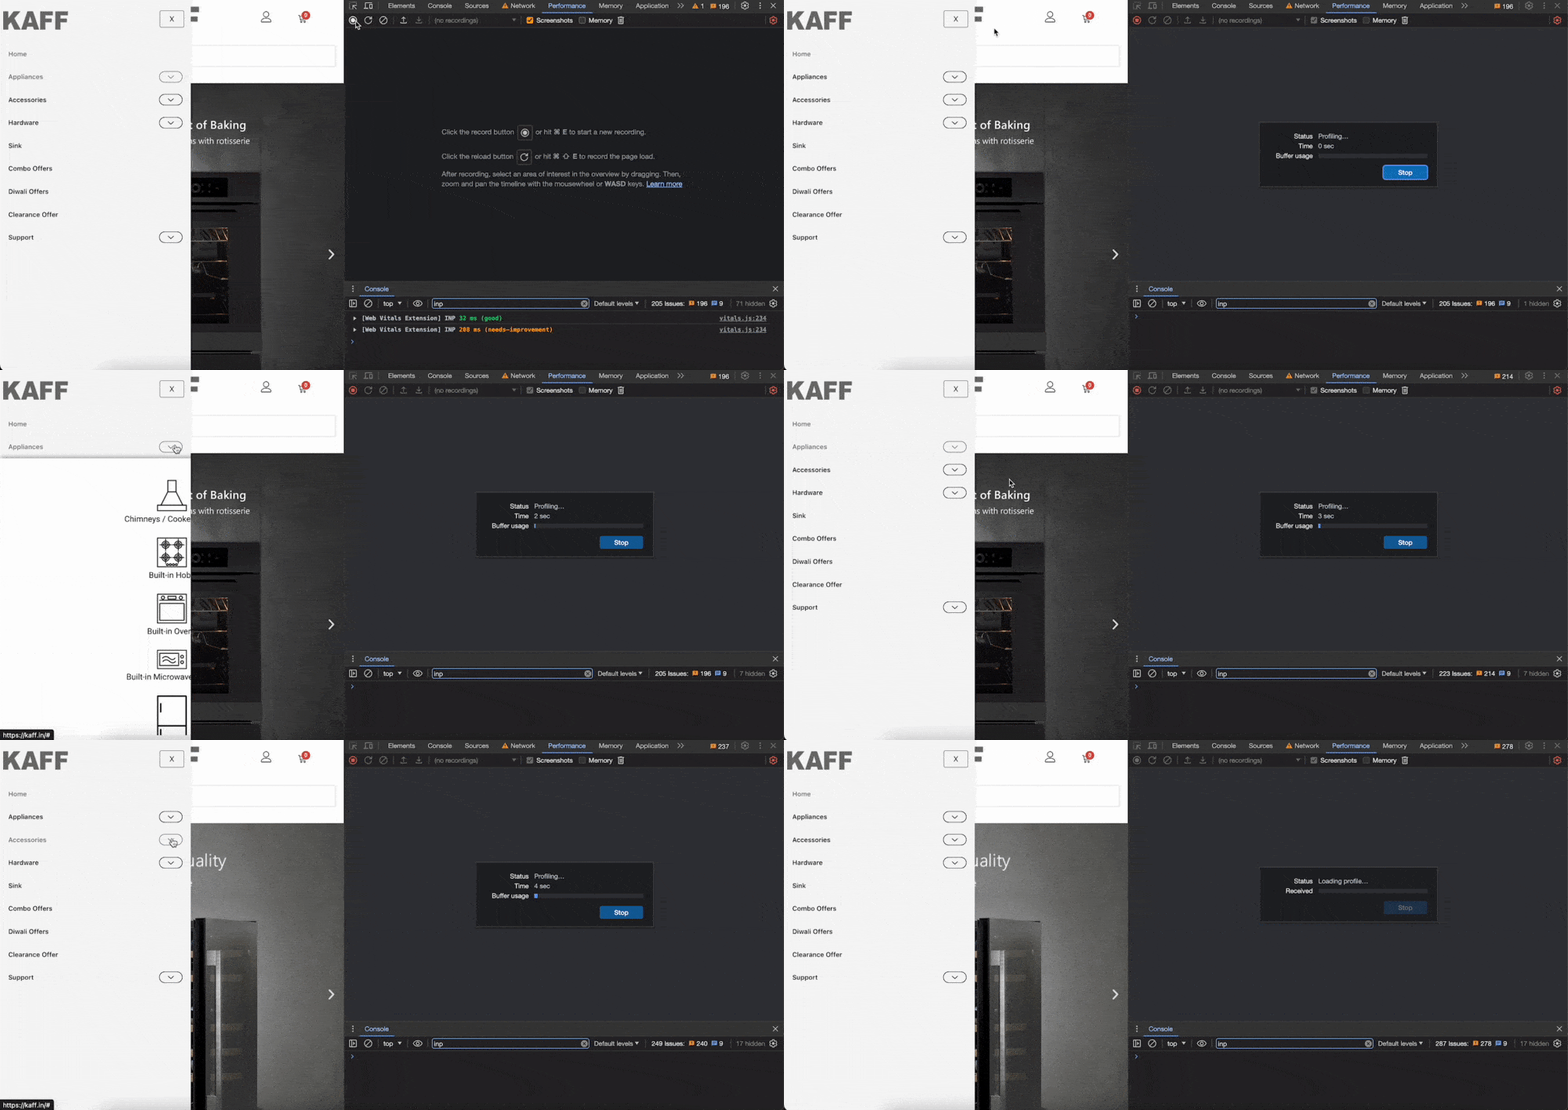
On the page you want to test, click “Inspect”, open Chrome DevTools, and navigate to the Console tab:
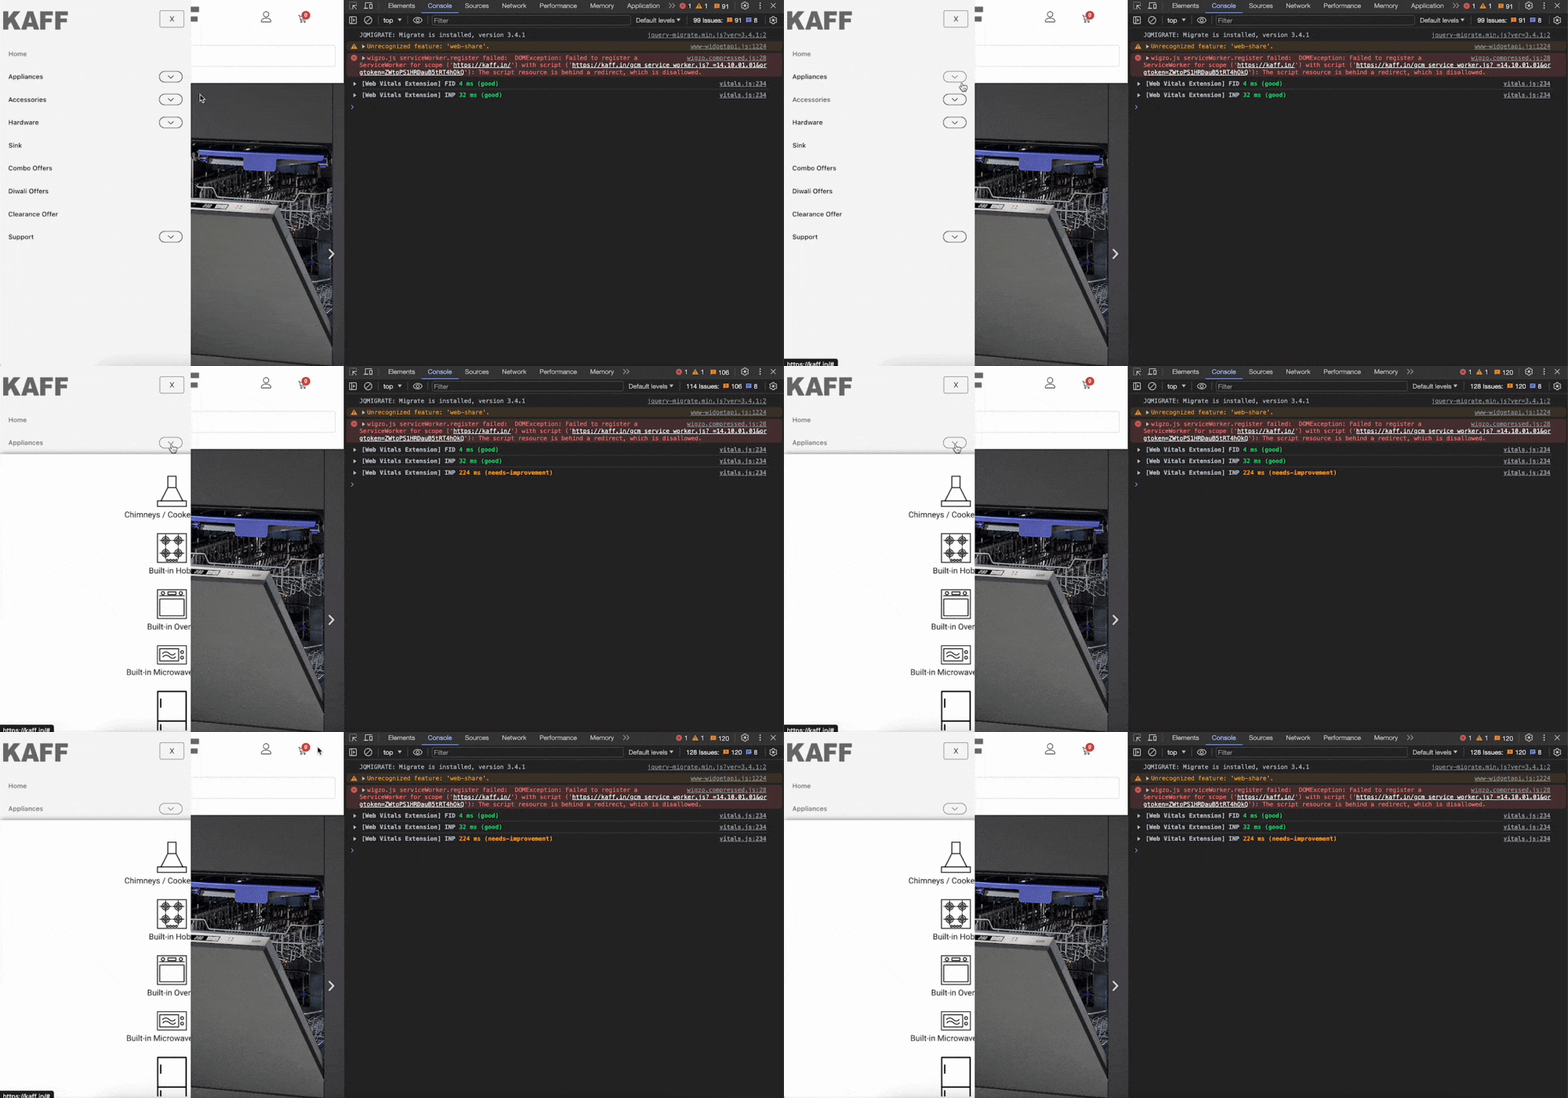
From there, you can click around your page and identify the element that’s causing poor INP:
Step 3: Use the Performance Profiler
Then, you can go to the Performance tab and use Chrome’s Performance profiler to record the trace of the event:
Simply hit the record button and click on the element:
Next, in the Main chart, check out the tasks the browser had to perform to process the interaction.
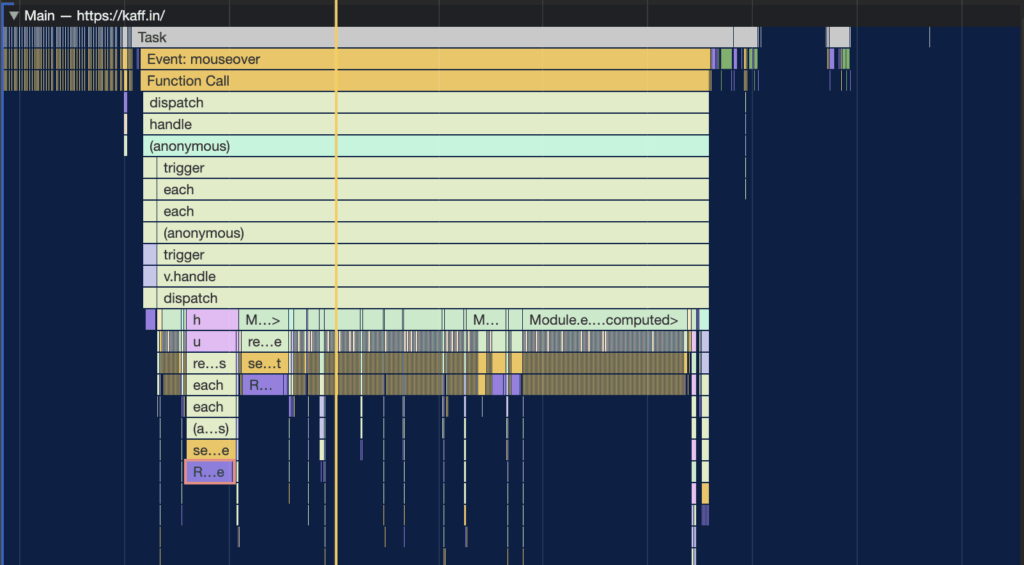
Click on the longer tasks, and in the Summary tab, you will find more information about them:
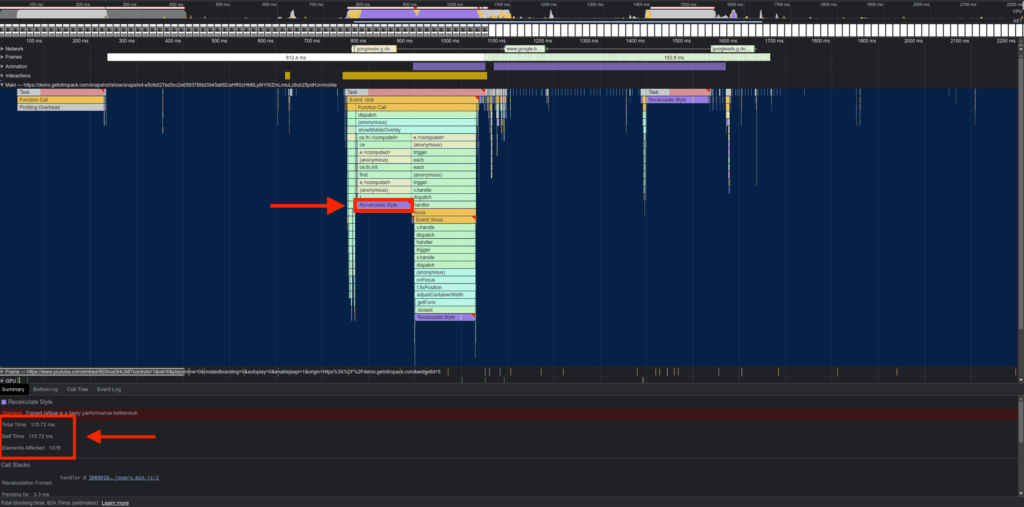
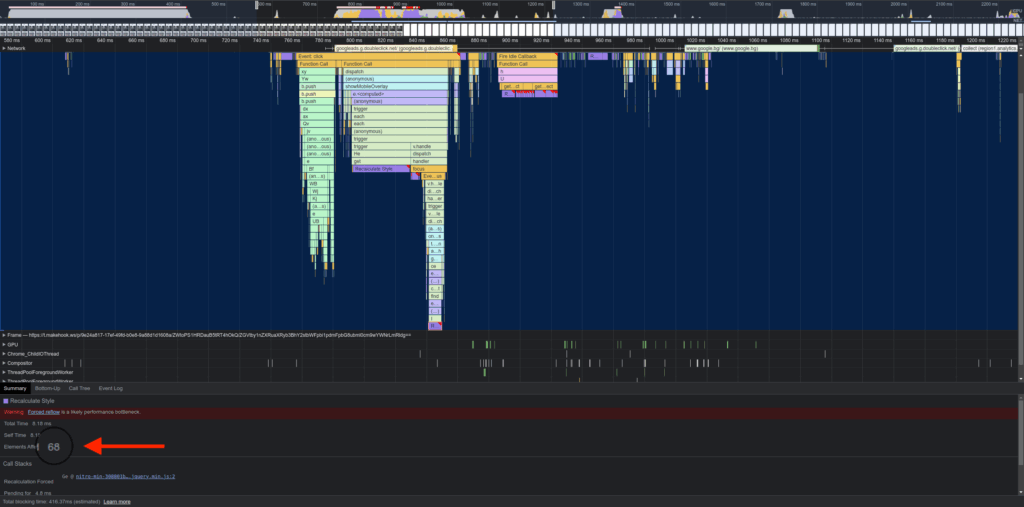
In the example above, we can see that the affected elements are 1076, which automatically implies that the site has a larger DOM.
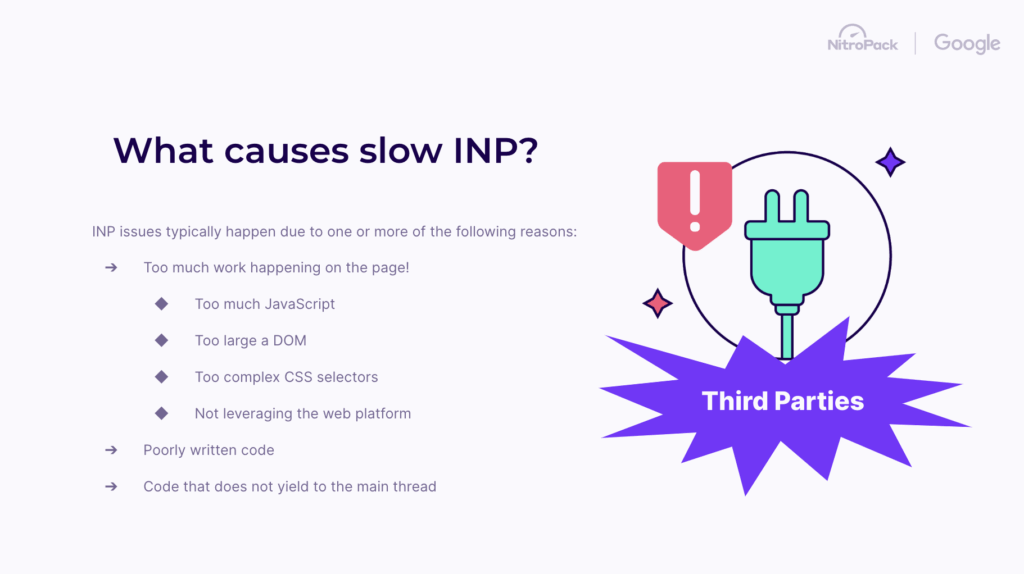
In most cases, longer tasks and INP issues are caused by:
- Too much JavaScript
- Too large DOM
- Too complex CSS selectors
- Not leveraging the web platform
- Poorly written code
- Code that does not yield to the main thread
2. Reduce large DOM size
The DOM is a document model representing HTML as a tree of branches and nodes.
Each branch of the tree ends in a node, and each node contains objects. A node represents part of the document, like an element, text string, or comment.
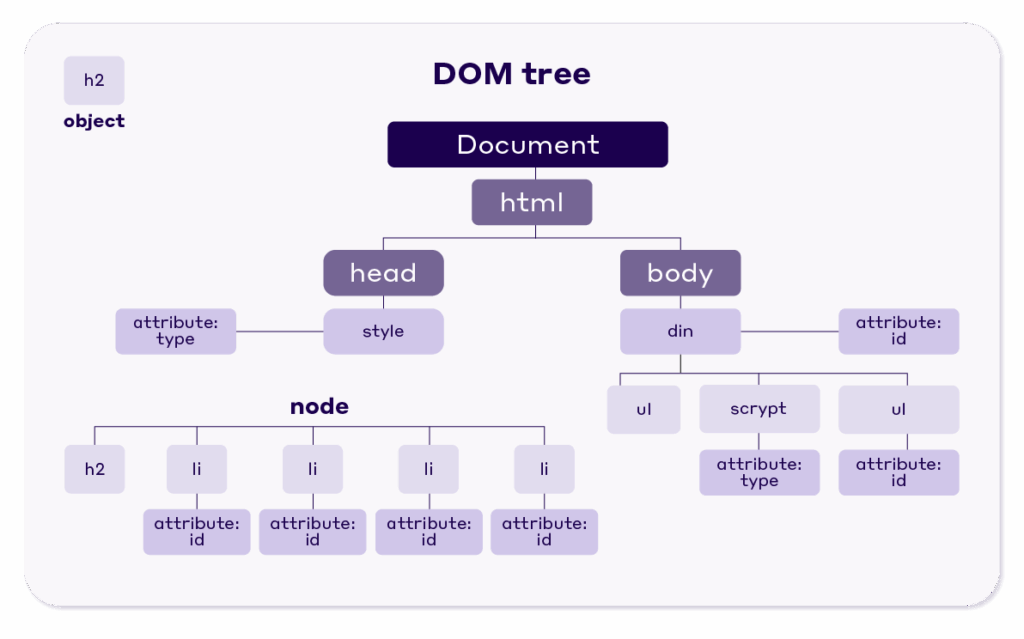
A large DOM size is a surefire way to fail the INP assessment. So to ensure that won’t happen, you need to reduce your DOM size, or to put it another way – you need to reduce DOM depth.
Target a DOM depth under 1,400 nodes and consider the following strategies to achieve it:
- Select well-coded plugins and themes
- Limit JavaScript-based DOM nodes
- Choose alternatives to page builders that produce excessive HTML
- Refrain from copying/pasting text directly into the WYSIWYG editor
- Consider splitting a single-page website into multiple pages
- Opt against hiding elements with
display:none - Simplify CSS declarations and JavaScript usage
Adhering to these techniques ensures a leaner, more efficient DOM size, enhancing your site’s INP performance.
3. Apply HTML Lazy Load
Lazy loading in HTML refers to optimizing online content by loading it only when needed rather than all at once when a page loads.
NitroPack’s HTML Lazy load feature removes the pre-defined CSS DOM selectors from the HTML cache. Then, it loads them asynchronously as fragments in the background when the user scrolls on the page.
Applying HTML lazy loading has its fair share of benefits when it comes to boosting your page’s responsiveness:
- Lower Initial Payload. Lazy loading reduces the amount of data that needs to be loaded when the page is first accessed.
- Lesser Requests. It decreases the number of HTTP requests during the initial page load, freeing up bandwidth and reducing load on the server.
- Reduced Workload. The browser’s main thread has less work to do during the initial load (fewer images to decode and render).
- Smooth Interaction. With less workload, the main thread can dedicate more of its resources to processing user interactions like scrolling and clicking, resulting in a smoother user experience.
4. Reduce Unused CSS
CSS files are considered render-blocking resources because when the browser encounters them, it cannot process any other tasks until it’s done processing them.
In other words, loading large CSS files will inevitably block the main thread and negatively affect your page’s responsiveness.
One way to optimize your INP score and responsiveness is to eliminate unused CSS.
Unused CSS refers to CSS rules not used on the current page.
There are tons of online tools that can strip down the unused CSS for you.
Or you can use an automated solution like NitroPack, which can do it for you. Our RUCSS feature works by finding CSS rules that aren’t used on the page and removing them.
There is no need to tweak your code manually; everything happens automatically.
Regardless of how you decide to handle your CSS, applying all the mentioned techniques will inevitably help you optimize your INP and responsiveness.
And getting back to our example – before the optimizations, the website had a large DOM size with more than 1000 elements affected.
After the optimizations, we managed to decrease the number of affected elements to 68:
Interaction to Next Paint FAQ
What do I do if the code causing the issue is not under my control?
The first thing you could do is contact the vendor providing the code and see if they will cooperate to fix the issue. If that’s not possible, consider removing the third-party plugin/service altogether and replacing it with an optimized alternative.
What if my interaction is long-running (e.g., uploading or processing a video)? Do I need to complete this within 200ms?
The short answer would be no. As was mentioned in the webinar, INP measures the time from the interaction to the next paint, not to the full length of the interaction. The best option here is to visualize a loading bar or some animation that will signal to the user that their interaction is registered and it’s being processed.
Can’t I cheat INP by doing a non-meaningful update before doing the processing?
As Barry Pollard highlighted during the webinar – anything that signals the user that the browser is processing their interaction is more than good enough. That’s exactly what Google wants site owners, developers, and webmasters to do with their websites, as this provides users with immediate feedback and a better experience.
Is there a best way to have videos on your page that won’t lower your INP?
The best way to do it is by using a plugin that allows you to embed the video with the facade pattern. This way, instead of loading the video, you will just load the thumbnail version, and the user will have to click on it to become interactive. Alternatively, if you’ve decided to self-host the video, leveraging a Content Delivery Network (CDN) is a great way to speed up the data-delivering process.
Will INP be added to the Lighthouse extension once it goes live? Or will it be proxied by a different metric like FID is currently by TBT?
Similar to First Input Delay, INP will be proxied by TBT. Total Blocking Time measures how long the main thread is being blocked, directly correlating with INP.
Lazy loading scripts became a common method, especially in WordPress. If heavy scripts are loaded after user interaction, does that possibly slow down INP?
Generally speaking, it’s a good practice to offload scripts that are not immediately necessary when the user first lands on the page. But you need to be careful and lazy load only until the loading gets out of the way. Try not to defer scripts until the user starts interacting with the page, as that might negatively impact your INP score and overall user experience.

