TL;DR:
NitroPack’s Smart Rendering speeds up long WordPress pages by reducing the amount of work the browser performs during the initial page load. Instead of rendering every section immediately—including content visitors haven’t reached yet—it intelligently delays rendering below-the-fold content until it’s about to enter the viewport.
The result is a faster-loading, more responsive website with improved Core Web Vitals, smoother scrolling, and better performance on content-heavy pages—all without removing content or affecting SEO.
Your INP score is failing, and PageSpeed Insights won’t tell you why. You get a red number and a “poor” rating, but not the one click, tap, or keypress that’s at fault.
With Interaction to Next Paint, this is usually the hardest part—finding the slow interaction. Once you know where it is, fixing it is relatively straightforward. If that’s something you need to do, keep reading as we work through INP’s three phases (input delay, processing time, and presentation delay), and show you how to improve each one, either by hand or automatically.
Test NitroPack yourself


By submitting, you agree to the WP Engine Terms of Service and acknowledge the Privacy Policy.
What is Interaction to Next Paint (INP)?
Interaction to Next Paint (INP) is the Core Web Vitals metric that measures how responsive your page feels, tracking the delay on every click, tap, and keypress a visitor makes during their whole visit. It watches all of those interactions and reports the single slowest one as your page’s score.
On March 12, 2024, INP took over from First Input Delay as one of Google’s three Core Web Vitals. This is because FID only ever timed the first interaction on a page, usually a click during load, so a good FID told you your site made a decent first impression and nothing more, whereas INP keeps watching. Around 90% of the time a visitor spends on a page happens after it loads, so a filter that stalls deep in checkout or a search box that freezes on an internal page now counts against you, long after that first click.
“Interaction to Next Paint is a huge step toward a better way to measure the user experience on the web. Undoubtedly, it’s more comprehensive than First Input Delay, which, as Google says, has its limitations.”
– Ivaylo Hristov, CTO of NitroPack.
Google measures INP in the field, at the 75th percentile of your page loads, split across mobile and desktop. On busier pages, it discounts the occasional outlier—the worst interaction for every 50—so one random hiccup doesn’t define your score. What you’re left with is a number that reflects what most of your visitors actually feel.
How is INP calculated?
If you want your INP score to go from poor to good, you need to understand interaction latency.
So what exactly is interaction latency?
Interaction latency refers to the delay or lag experienced between a user’s input or action and the resulting response or output on the screen. It is a crucial factor in determining your site’s responsiveness and perceived performance.
Three primary components contribute to interaction latency:
- Input delay: The time between when a user starts interacting with the page and when the associated actions or event callbacks begin to execute. It includes the physical or technical delays caused by the input device (e.g., keyboard, mouse, touchscreen) and the system’s input processing mechanisms.
- Processing time: Once the user input is received, the system must process it to determine the appropriate response or action. Processing time refers to the duration required for the system to analyze and interpret the input data, perform any necessary calculations or operations, and generate the output or response.
- Presentation delay: After the system has generated the output or response, there is typically a delay before it is presented to the user. Presentation delay encompasses the time it takes for the system to update the display, render graphics or user interfaces, and deliver the output to the user interface or output device.
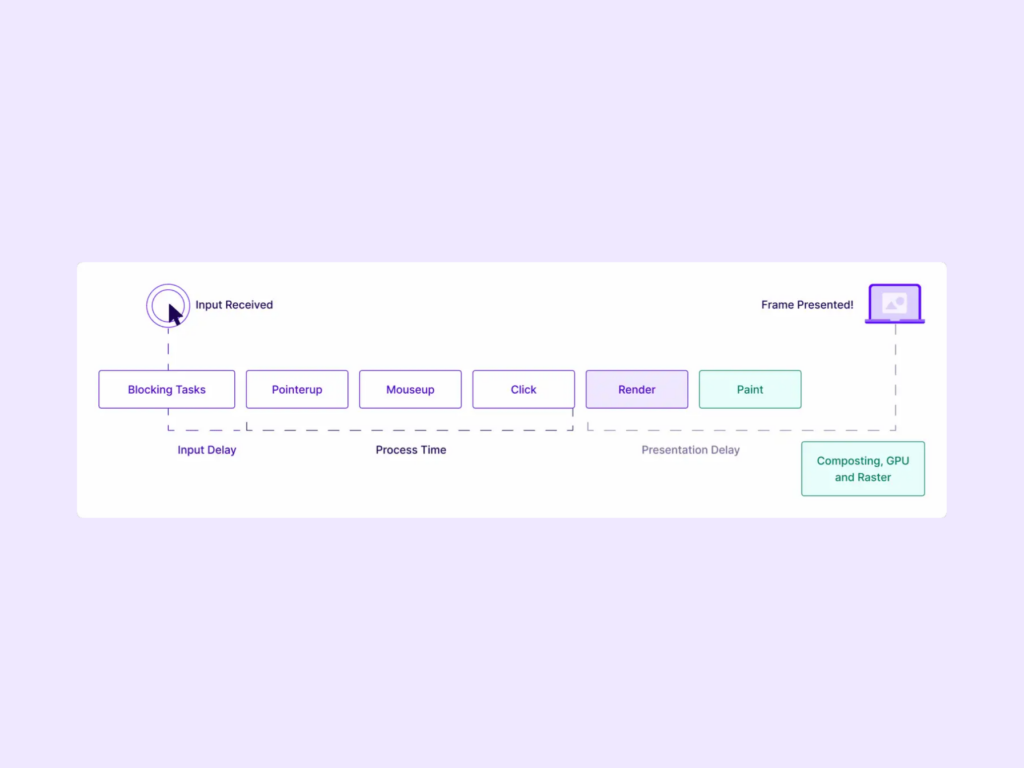
Keep these three names in mind, because the rest of this guide is built around them. Once you know which phase is inflating an interaction, you know which fix to reach for: There’s no sense breaking up long tasks when the problem is a heavy render, or trimming the DOM when the delay lives in your JavaScript.
What is a good INP score?
Google grades INP against three thresholds, measured at the 75th percentile of your page loads:
- 200 milliseconds or below—good. The page responds quickly enough that interactions feel instant.
- Between 200 and 500 milliseconds—needs improvement. Visitors feel the lag, even if they can’t name it.
- Above 500 milliseconds—poor. The delay is obvious, and it’s the band that tips your Core Web Vitals from passing to failing.
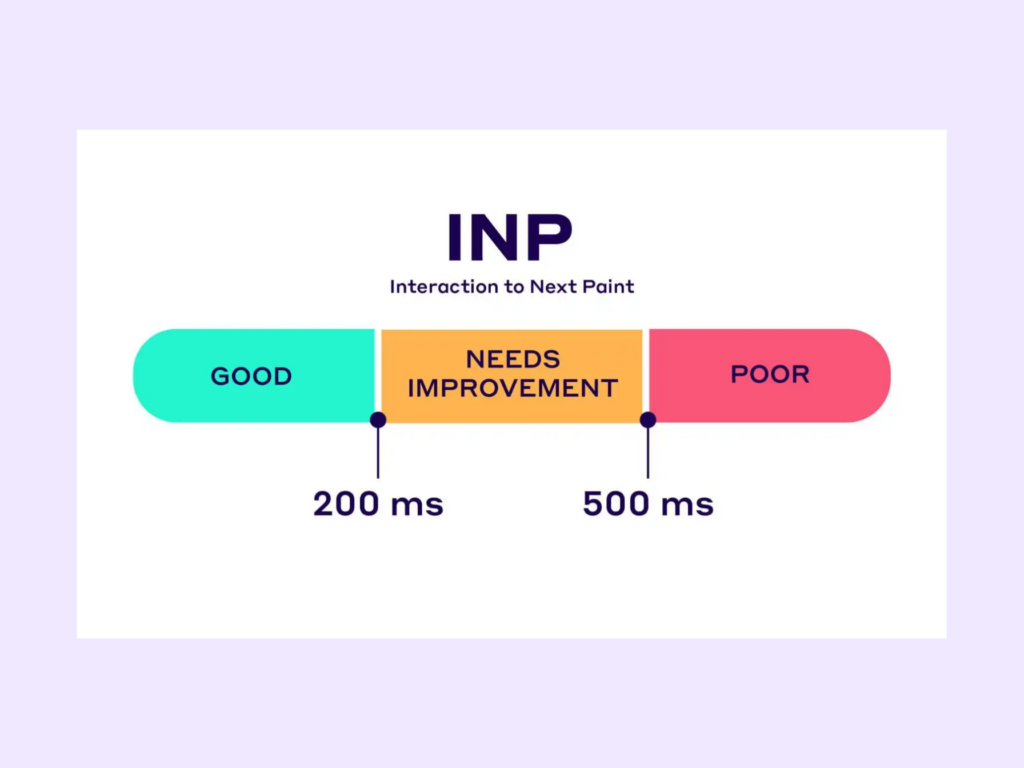
To guarantee that you achieve this objective for the majority of your users, it is recommended to assess the 75th percentile of page loads, segmented across mobile and desktop devices, including the ones on slower phones and shakier connections. And because these are field thresholds, they’re scored on real Chrome users out in the world, not the lab test you ran this morning.

So if your score sits in the amber or red band, your first job is to find which interaction put you there—which is exactly where the next section starts.
Find the interactions dragging your score down
PageSpeed Insights hands you a number, not a name. It flags that INP is failing but never which button, form field, or menu caused it, and you can’t fix an interaction you haven’t identified. Work through it in order:
- Get field data to name the interaction. Start with the Web Vitals Chrome extension, which shows INP live as you click around a page. For more detail, Google’s web-vitals JavaScript library captures the detail you need: The INP value, the element selector responsible for it, the loading state (whether the interaction happened during or after load), the interaction’s start time, and the event type (click, keypress, or tap).
- Reproduce it in Chrome DevTools. Open the Performance panel, which records live INP as you interact. Expand the logged interaction to see how its three phases split, then record a full trace to dig into the script behind the slow one. If your lab tool only reports Total Blocking Time, treat it as a rough hint: TBT is a stand-in for INP, not the number you’re actually chasing.
- Go deeper on the script, if you need to. The Long Animation Frames API shows the work behind a slow frame. Treat it as diagnostic evidence of what executed, not a full JavaScript profile.
- Field data lags. CrUX runs on a rolling 28-day window, so a fix you verify in DevTools today can take weeks to appear in Search Console. That delay is the metric catching up, not your fix failing.
Once you’ve named the offending interaction and know which phase is inflating it, you can head straight for the right fix, starting with the most common culprit: Input delay.
Reduce input delay by breaking up long tasks
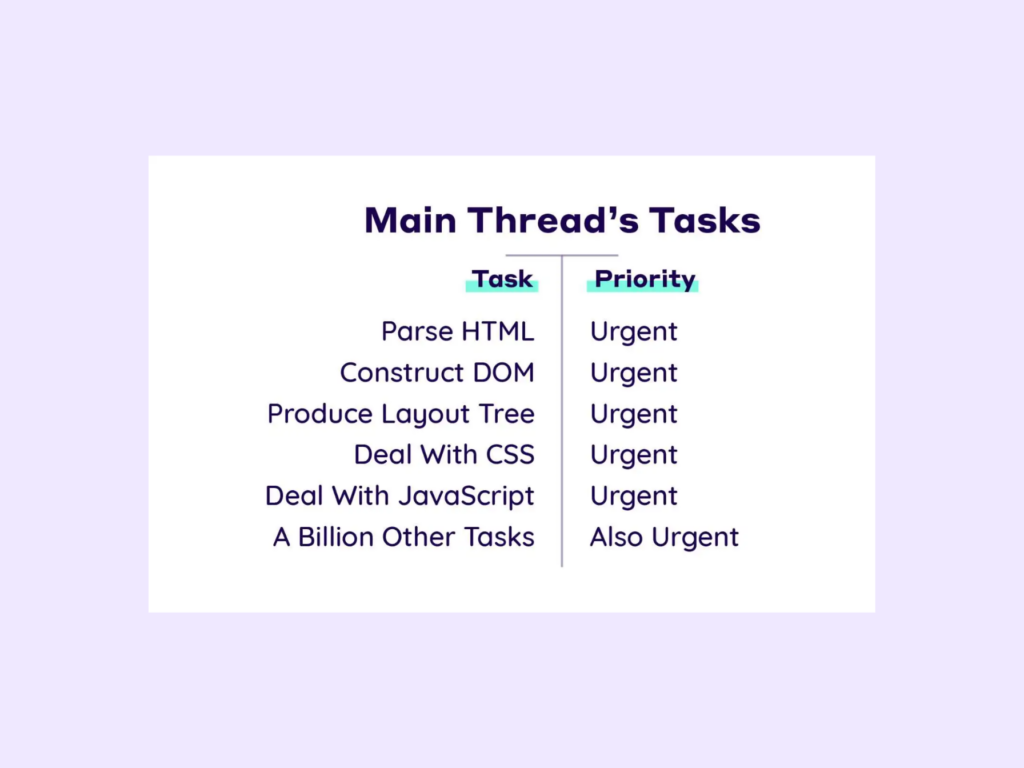
Input delay is the wait from a visitor’s action until the browser starts to run the event handlers for it, and when that wait stretches out, the usual reason is a long task already running on the main thread, holding the browser hostage until it finishes.
Now, while there might be dozens of tasks that need to be executed, the main thread can only process one task at a time, and any task that takes longer than 50 milliseconds is a long task. When one runs, the browser can’t respond to a click or a tap, so the interaction just waits. The fix is to break that work into smaller chunks and yield to the main thread between them, giving the browser a chance to handle the pending interaction sooner.
Say you’re processing a queue of jobs in a loop. As one task, it blocks everything until every job is done:
function processData () {
  for (const item of largeDataArray) {
    // Process the individual item here.
  }
}
Add a yield point inside the loop and the browser can slip the visitor’s interaction in between iterations:
async function runJobs(jobQueue) {
  for (const job of jobQueue) {
    // Run the job:
    job();

    // Yield to the main thread:
    await yieldToMain();
  }
}
Each await hands control back to the browser, so a click no longer waits behind the entire queue.
When to use scheduler.yield or setTimeout
yieldToMain() above isn’t built in—you define it, and how you define it decides how well the yield behaves.
scheduler.yield() is the purpose-built API, and its advantage is a prioritized continuation: the rest of your function runs before other queued tasks, so third-party scripts can’t jump the line while you’re mid-job. It’s supported in Chrome, Edge, and Firefox, but not Safari as of 2026, so ship it with a setTimeout fallback. A Promise-wrapped setTimeout(resolve, 0) still yields, but its continuation drops to the back of the queue, so other tasks can run before your work resumes.
Google’s own fallback helper does exactly that—scheduler.yield() where it exists, setTimeout everywhere else:
function yieldToMain () {
  if (globalThis.scheduler?.yield) {
    return scheduler.yield();
  }

  // Fall back to yielding with setTimeout.
  return new Promise(resolve => {
    setTimeout(resolve, 0);
  });
}
One thing to avoid: Don’t reach for requestIdleCallback to break up interaction work. It’s built for genuinely idle moments, and on a busy main thread it can fire seconds late—far too slow for anything a visitor is waiting on.
Defer non-critical and third-party JavaScript
Not all of the main-thread work slowing your interactions is yours. Tag managers, analytics, consent banners, and chat widgets all run JavaScript on the same main thread, and they pile on more of it than you’d expect. You choose which tools load and when they fire, but not how each vendor built its script or what its next update ships.
The principle is the same as breaking up long tasks: Keep non-essential work clear of interactions. Delay non-critical JavaScript until after the initial page load, or until its feature is about to be used, and never run heavy script setup synchronously inside a visitor’s first interaction.
Where you can’t delay a tag outright, the tractable moves are:
- Update vendor script versions. Preply cut 40ms of INP just by moving one consent tool from V2 to V3.
- Tighten tag governance. Control who can add tags in your tag manager, and audit what’s already firing.
- Move tags server-side. Shift execution off the browser with server-side Google Tag Manager or Cloudflare Zaraz.
Partytown is another route: It moves compatible third-party scripts into a web worker, off the main thread entirely. It doesn’t cover every tag, though—scripts that need synchronous DOM access can break or lose the benefit, so test each one and leave the incompatible ones alone.
On WordPress or WooCommerce, NitroPack turns these same techniques into toggles:
- Delayed Scripts (Plus plan and up) holds non-critical JavaScript until a visitor interacts with the page.
- Optimize GTM (Pro and Agency) keeps your GTM container running while pausing the third-party scripts it loads until first interaction.
Same effect as the manual work above, no script editing required.
Shorten processing time in your event handlers
Processing time is the middle phase: where the browser runs the event handlers tied to an interaction. When it’s the phase inflating your score, do less synchronous work inside the handler—keep only what updates state and shows the visitor something happened, and move the rest off the critical path.
A good order of operations inside a handler:
- Paint feedback first. Apply the DOM change that gives immediate visual feedback—the menu opening, the loading state—before anything else runs.
- Defer non-essential work. Push analytics, logging, and background tasks out of the current task so they don’t delay the paint.
- Chunk and yield the heavy work. Break remaining CPU-heavy work into independent pieces and yield between them, as you did for long tasks.
- Never defer validation. Anything required for correctness or security stays in the handler.
Rapid interactions need their own handling: keep keyboard input responsive, but debounce the expensive follow-up (a search request, a recalculation) until typing pauses. For streaming events like resize, debounce when only the final state matters and throttle when updates must keep pace.
Why does painting feedback early help? INP is measured to the next paint, so showing a loading state the moment a visitor clicks genuinely shortens the interaction the browser records—a real responsiveness win, and exactly what the metric rewards.
NitroPack’s Optimize Interactive Elements automates that visual-feedback tactic on WordPress and WooCommerce, painting a response earlier so interactions feel immediate. NitroPack reports it improving INP by 36% on desktop and 32% on mobile. It improves perceived INP by painting sooner; the underlying processing time is unchanged.
Offload heavy work to a web worker
If a single operation is genuinely heavy—parsing a large dataset, a complex calculation—move it to a web worker to run off the main thread and leave interactions free. It’s a custom-app technique that takes real engineering, so save it for cases that truly need it.
That’s the work before the paint. The last phase, presentation delay, is the paint itself.
Cut presentation delay and stop layout thrashing
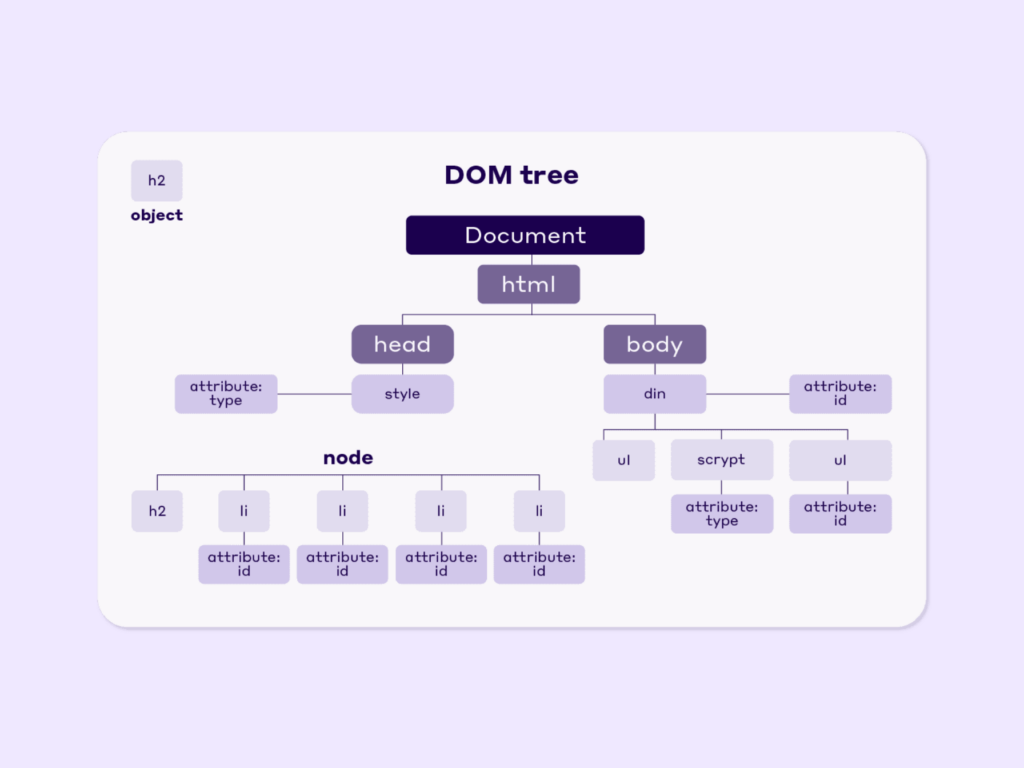
Presentation delay is the final phase: the time from when your event handlers finish to when the browser paints the next frame. Large Document Object Model (DOM) trees, expensive style and layout work, heavy painting, and long requestAnimationFrame() callbacks all stretch it out. (Forced layout inside a handler is a different problem—that counts against processing time, not presentation delay.)
The most common culprit is layout thrashing: Reading a layout property, writing to the DOM, then reading again, over and over, which forces the browser to recalculate layout repeatedly within a single frame. The fix is to batch your DOM reads together, then your writes, so layout is calculated once.
From there, work down the render cost:
- Trim the DOM. The DOM itself isn’t a problem, but its size might be. A large DOM size impacts a browser’s ability to render a page quickly and efficiently. According to Lighthouse, a page’s DOM size is excessive when it exceeds 1,400 nodes, so that’s a useful ceiling to stay under. The usual culprits are page builders that generate bloated HTML, poorly coded plugins and themes, and pages that create large numbers of nodes in JavaScript.
- Skip off-screen rendering. Apply content-visibility: auto to large, independent off-screen sections so the browser skips most of their rendering until they near the viewport. Pair it with a realistic contain-intrinsic-size to reserve space and avoid layout shifts.
- Lazy-load below-the-fold media. Defer off-screen images and iframes so they don’t compete for render time up front.
- Virtualize long lists. When thousands of mounted rows make updates expensive, render only what’s on screen.
Together, these are some of the most reliable ways to optimize Interaction to Next Paint on a render-heavy page. NitroPack applies content-visibility and lazy loading automatically across images, iframes, and off-screen content, so much of this happens without hand-tuning.
And render cost is exactly where phones struggle most—which is why a page can pass INP on desktop and still fail it on mobile.
Why mobile INP fails when desktop passes
Here’s the trap: mobile INP lags desktop by a wide margin. In the 2025 Web Almanac, 77% of sites hit “good” INP on mobile against 97% on desktop—a 20-point gap. A green desktop score can be hiding a failing mobile one.
The reason is the hardware you test on. A mid-tier Android phone has a fraction of your laptop’s CPU power, so a handler that finishes instantly on your machine can drag on a real device. Even a 6x CPU throttle in Chrome DevTools understates it—the emulated slowdown is still faster than the phones your visitors actually hold.
So test the way your visitors browse. Use the calibrated CPU throttling in Chrome DevTools 134 and later, which models real device classes more honestly, then confirm every phase fix against device-segmented field data rather than a single desktop lab run. NitroPack’s Optimize Interactive Elements targets this mobile gap directly, since the perceived-responsiveness win lands hardest on slower devices.
Fixing all of this by hand across a WordPress site, then re-testing on mobile, is a lot of ongoing work—which raises a fair question: how much of it can you automate?
Automate your INP fixes with NitroPack
You’ve now seen the manual version of every lever: Break up long tasks, defer third-party scripts, trim handler work, paint feedback sooner, and cut render cost. On a WordPress or WooCommerce site, NitroPack does the same jobs as settings you switch on.
| The manual technique | The NitroPack toggle |
| Defer non-critical and third-party JavaScript | Delayed Scripts, Optimize GTM |
| Paint immediate visual feedback | Optimize Interactive Elements |
| Skip off-screen rendering and lazy-load media | content-visibility and lazy loading, applied automatically |
| Prefetch the next page before the click | Speculative Loading |
According to internal research, Optimize Interactive Elements improves INP by 36% on desktop and 32% on mobile, and Speculative Loading—built with Google’s Chrome team—delivers up to 55% on prerendered pages.
🙂 Important
NitroPack is a full performance suite for WordPress and WooCommerce, covering caching, image optimization, a CDN, and the INP features above, and those INP features sit on paid plans. And Optimize Interactive Elements improves perceived INP by painting earlier; it doesn’t rewrite your processing time. Within those bounds, it turns a long, ongoing hand-optimization job into a setup you finish in an afternoon.
The free plan is the no-credit-card way to see what it does on your own site before committing to anything.