
TL;DR:
Real user monitoring is field data from actual visits. The 0–100 score on the same PageSpeed report is a lab test, and the two can disagree. Search assesses the field numbers, and Google already publishes them for free in PageSpeed Insights and Search Console—so most site owners don’t need to buy a RUM product. Engineering teams debugging individual sessions are the exception.
When you run a page through PageSpeed Insights, there are two things on the screen. One is a Core Web Vitals assessment that says Passed or Failed, and the other is a performance score out of 100. So, which is which, and does one matter more than the other?
Real user monitoring is the first one. It’s built from people who actually visited your site, and it can absolutely come back as Failed while the score underneath looks perfectly healthy.
You’ll also see the term in Search Console, and in comparisons that put it against synthetic monitoring. Wherever you meet it, the questions are the same: what does it measure, and do you have to pay for any of it?
What is real user monitoring?
Real user monitoring (RUM) is performance data measured during real visits to your site. A small script in the visitor’s browser records how the page behaved and sends the timings back. Google calls it field data and says the two terms are interchangeable. Because it comes from real people, it carries their devices, networks, and locations, which is also why it can’t measure a staging site or a page nobody has visited.
It records different things, depending on what’s collecting it:
- Page-load timings, including how long the largest element took to appear.
- Client-side errors from JavaScript that failed in someone’s browser.
- Frustration signals like rage clicks on an unresponsive button.
PageSpeed Insights reports that field data against the three Core Web Vitals, the metrics Google says its core ranking systems seek to reward. Synthetic monitoring, the usual point of comparison, arrives at its numbers another way.
How does RUM differ from synthetic monitoring?
RUM reports what happened to real visitors; synthetic monitoring runs a scripted test on a schedule, from a location you pick. A synthetic test fixes the things a real visit varies: one device, one network, one location, and usually an empty cache. That control makes it useful for diagnosis: change one thing, see what moved.
One thing it can’t reach is Interaction to Next Paint, which only exists when someone actually interacts; lab tools estimate it with Total Blocking Time. Google’s advice when you have both is to prioritize the field data.
⚠️ Important:
“RUM data” also means something else in networking. IBM’s NS1 Connect uses it to decide where DNS sends each query, picking the fastest available connection.
The two numbers on a PageSpeed report
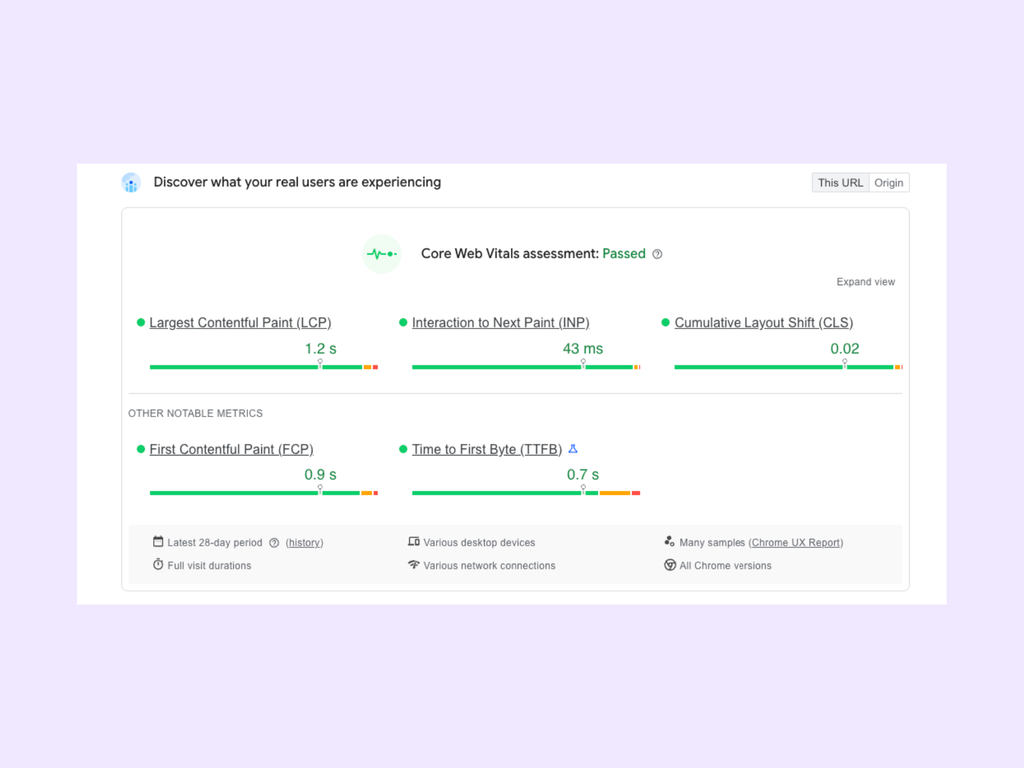
A PageSpeed Insights report opens with Core Web Vitals from real Chrome visits, then gives a separate 0–100 score from one simulated load.
The first block is Chrome User Experience Report (CrUX) data, covering the previous 28 days and reported at the 75th percentile. Google picks that percentile to show the slower experiences on your site, where most of the frustration is.
That window rolls: PSI refreshes daily, but every reading still covers the trailing 28 days, so a fix you shipped yesterday takes weeks to show fully. The field numbers are LCP, INP, and CLS, with FCP reported alongside them, and each has its own threshold and benchmark.
The 0–100 underneath comes from Lighthouse, which loads the page once on a mid-tier phone over a throttled mobile connection.
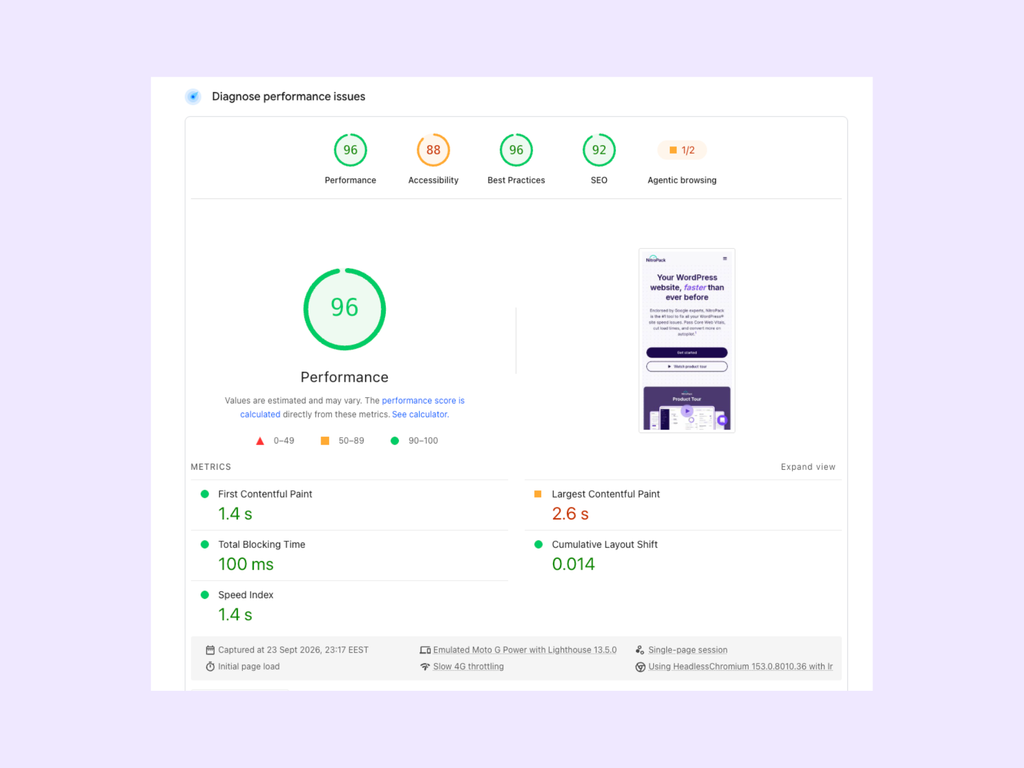
The two can disagree, and Google’s PageSpeed documentation says why: good lab data doesn’t necessarily mean real-user experiences will be good. In our experience, the Performance score also doesn’t reflect how real visitors experience your website, which is why we recommend weighing the RUM report more than the performance score alone.

Understanding the Difference Between Your PSI Score and Core Web Vitals
CrUX is not a vendor RUM product
The Core Web Vitals assessment Search uses comes from the Chrome User Experience Report, a public dataset Google publishes. CrUX counts a visit only when the user has opted into Chrome’s usage reporting, syncs their browsing history without a passphrase, and is on desktop Chrome or Chrome for Android. Chrome on iOS, Android WebView apps, and other Chromium browsers like Edge send nothing. The page itself has to be publicly indexable and clear a visitor threshold Google doesn’t publish.
Google’s thresholds are LCP within 2.5 seconds, INP under 200 milliseconds, and CLS under 0.1, each at the 75th percentile. Good Core Web Vitals align with what Google’s core ranking systems “seek to reward”—its own wording, and short of a promise about where you rank.
| Chrome UX Report | A vendor RUM product | |
|---|---|---|
| Who’s counted | Opted-in Chrome, desktop and Android | Anyone who loads the page, any browser, often sampled |
| Who can read it | Anyone, free | Your account only |
| What Search assesses | This one | Nothing from it |
Those same eligibility rules are why a report can come back with no field data at all.
No data does not mean your site is slow
An empty Core Web Vitals report means too few eligible Chrome visits to build a distribution, and says nothing about how fast the page is, so no need to panic.
PageSpeed Insights first falls back to origin level, pooling every page on the site; when even the origin is short of samples, the field block disappears entirely. That happens to new pages, quiet pages, and anything blocked from indexing—the eligibility rules working normally. If the page is missing because it’s noindexed or requires a login, speed work won’t populate it, so fix the eligibility first.
Until the field data populates, lab tools can still diagnose the page. A synthetic test still finds the render-blocking script or the oversized hero image, and it works on a page with no visitors at all.
Do you need a dedicated RUM product?
Most site owners don’t need a dedicated RUM product: the field Core Web Vitals that Search assesses are already free in PageSpeed Insights and Search Console.
A dedicated RUM product buys something different: session-level detail on data you collect yourself—replaying a session, tracing a JavaScript error back to the person who hit it, following a slow request into the backend.
Datadog, Dynatrace, and New Relic, for example, all sell that category. If you run an app where you need to trace a slow checkout to one user’s session, that could be a reason to look for such a tool. Setting one up means adding the vendor’s JavaScript to every page and keeping it current as the site changes.
How NitroPack moves your field numbers
NitroPack is a cloud site-speed service for WordPress and WooCommerce that can improve the field Core Web Vitals Search assesses. Chrome collects those visits; NitroPack works on the page they land on.
So, if you want to move your field numbers in the right direction, here’s what you need to do in order:
- Read the field data first. PageSpeed Insights and Search Console show what real visits produced.
- Then change the page. NitroPack’s Website Speed Test runs Lighthouse with your caching switched off and forecasts what 60+ optimizations would do to your Core Web Vitals.
- Wait for the window. The numbers move once the changes are live and the 28-day window catches up.
That forecast is a projection; your own field data is the verdict. In HTTP Archive’s August 2026 data, 56% of NitroPack sites passed all three Core Web Vitals on mobile, against 49% of WordPress sites overall (11,320 origins tested). The Free plan needs no credit card, so you can see where your own numbers land.
Test NitroPack yourself


By submitting, you agree to the WP Engine Terms of Service and acknowledge the Privacy Policy.
Frequently asked questions
Is real user monitoring the same as Core Web Vitals?
No. Real user monitoring is the method—measuring real visits—and Core Web Vitals are three of the metrics it produces. The same dataset can hold other load timings, JavaScript errors, and frustration signals that Search never looks at.
Can you get real user monitoring data for free?
Yes, Google publishes it. The Chrome User Experience Report covers any public page with enough eligible Chrome traffic, and you can read it in PageSpeed Insights or Search Console without paying or installing anything.
Does NitroPack collect real user monitoring data?
No. NitroPack is a cloud site-speed service that changes how your pages are built and delivered. It counts pageviews to meter your plan, but it doesn’t measure how each page performed in the visitor’s browser—the field Core Web Vitals that Search assesses come from Chrome.
Why is my PageSpeed score high but Core Web Vitals failing?
Because they measure different things. The 0–100 comes from one simulated load in a controlled environment; the Core Web Vitals assessment comes from real visits over the previous 28 days. A fast lab result and a slow real one can both be true.